
무작정 쇼트트랙 이재영


논픽션
Data visualization involves graphical and visual tools used in data analysis and decision making. The emphasis in this book is on recent trends and applications of visualization tools using conventional and big data. These tools are widely used in data visualization and quality improvement to analyze, enhance, and improve the quality of products and services. Data visualization is an easy way to obtain a first look at the data visually. The book provides a collection of visual and graphical tools widely used to gain an insight into the data before applying more complex analysis. The focus is on the key application areas of these tools including business process improvement, business data analysis, health care, finance, manufacturing, engineering, process improvement, and Lean Six Sigma. The key areas of application include data and data analysis concepts, recent trends in data visualization and ÒBig Data,Ó widely used charts and graphs and their applications, analysis of the relationships between two or more variables graphically using scatterplots, bubble graphs, matrix plots, etc., data visualization with big data, computer applications and implementation of widely used graphical and visual tools, and computer instructions to create the graphics presented along with the data files.
© 2016 Business Expert Press (전자책): 9781631573361
출시일
전자책: 2016년 12월 31일

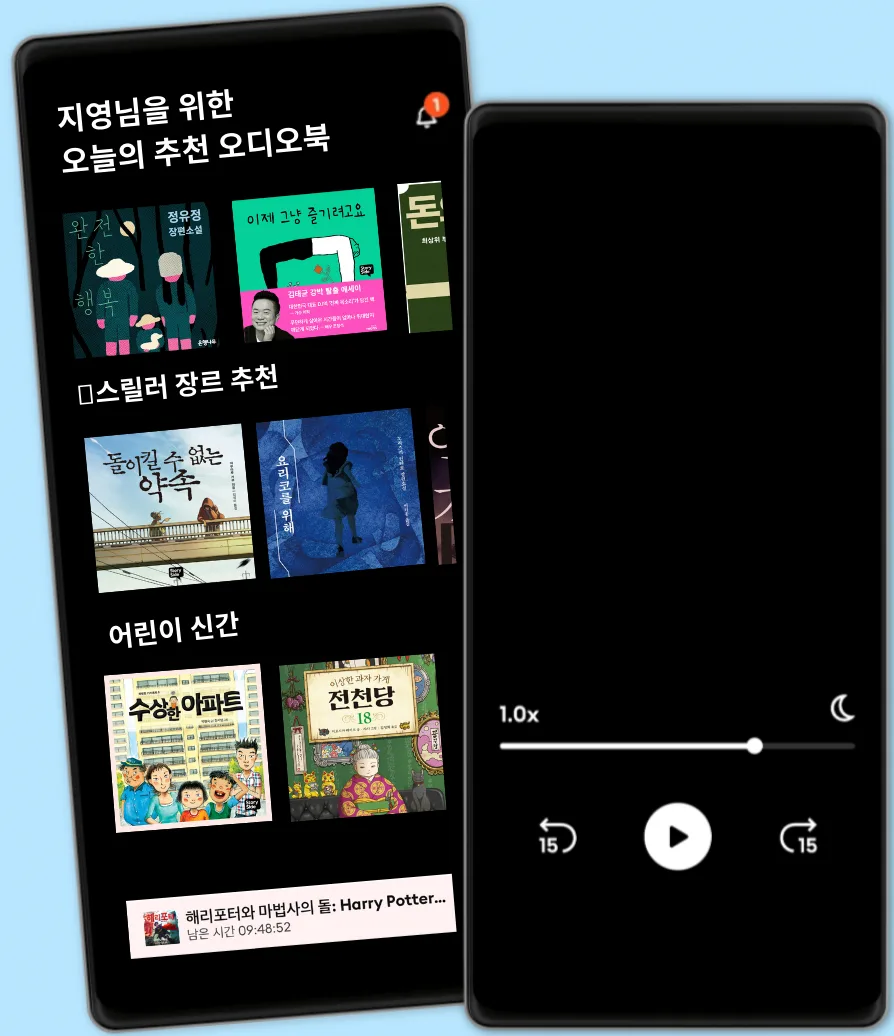
국내 유일 해리포터 시리즈 오디오북
5만권이상의 영어/한국어 오디오북
키즈 모드(어린이 안전 환경)
월정액 무제한 청취
언제든 취소 및 해지 가능
오프라인 액세스를 위한 도서 다운로드
5만권 이상의 영어, 한국어 오디오북을 무제한 들어보세요
13800 원 /월
사용자 1인
무제한 청취
언제든 해지하실 수 있어요
친구 또는 가족과 함께 오디오북을 즐기고 싶은 분들을 위해
매달 21500 원 원 부터
2-3 계정
무제한 청취
언제든 해지하실 수 있어요
21500 원 /월