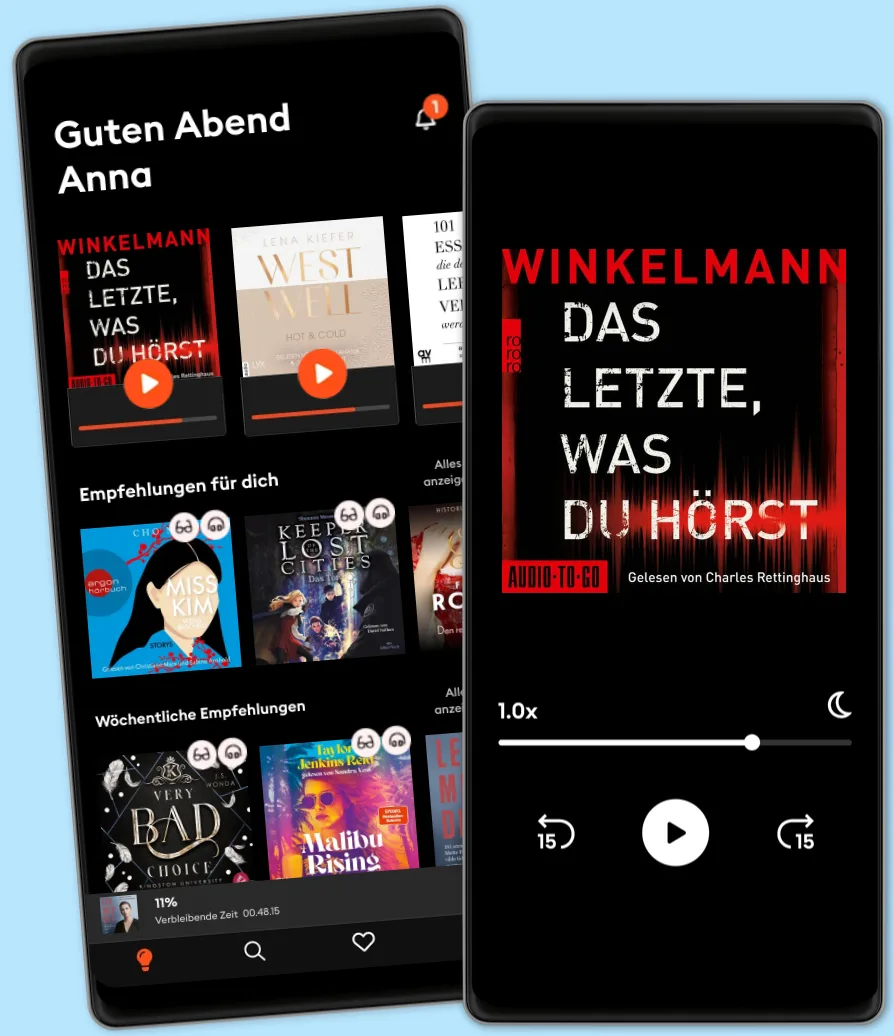
Hören und Lesen
Tritt ein in eine Welt voller Geschichten
- Mehr als 600.000 Hörbücher und E-Book
- Jederzeit kündbar
- Exklusive Titel und Originals
- komfortabler Kinder-Modus

Interactive Data Visualization with Python: Present your data as an effective and compelling story, 2nd Edition
- Sprache
- Englisch
- Format
- Kategorie
Sachbuch
Create your own clear and impactful interactive data visualizations with the powerful data visualization libraries of Python
Key Features
• Study and use Python interactive libraries, such as Bokeh and Plotly
•
• Explore different visualization principles and understand when to use which one
•
• Create interactive data visualizations with real-world data
Book Description
With so much data being continuously generated, developers, who can present data as impactful and interesting visualizations, are always in demand. Interactive Data Visualization with Python sharpens your data exploration skills, tells you everything there is to know about interactive data visualization in Python.
You'll begin by learning how to draw various plots with Matplotlib and Seaborn, the non-interactive data visualization libraries. You'll study different types of visualizations, compare them, and find out how to select a particular type of visualization to suit your requirements. After you get a hang of the various non-interactive visualization libraries, you'll learn the principles of intuitive and persuasive data visualization, and use Bokeh and Plotly to transform your visuals into strong stories. You'll also gain insight into how interactive data and model visualization can optimize the performance of a regression model.
By the end of the course, you'll have a new skill set that'll make you the go-to person for transforming data visualizations into engaging and interesting stories.
What you will learn
• Explore and apply different interactive data visualization techniques
•
• Manipulate plotting parameters and styles to create appealing plots
•
• Customize data visualization for different audiences
•
• Design data visualizations using interactive libraries
•
• Use Matplotlib, Seaborn, Altair and Bokeh for drawing appealing plots
•
• Customize data visualization for different scenarios
Who this book is for
This book intends to provide a solid training ground for Python developers, data analysts and data scientists to enable them to present critical data insights in a way that best captures the user's attention and imagination. It serves as a simple step-by-step guide that demonstrates the different types and components of visualization, the principles, and techniques of effective interactivity, as well as common pitfalls to avoid when creating interactive data visualizations. Students should have an intermediate level of competency in writing Python code, as well as some familiarity with using libraries such as pandas.
© 2020 Packt Publishing (E-Book): 9781800201064
Erscheinungsdatum
E-Book: 14. April 2020
Anderen gefällt...
- Data Visualization Guide: 4 BOOKS IN 1. Big and Complete Guide to Data Mining and Visualization Alex Campbell
- Data Analysis Introbooks Team
- Data Science For Dummies: 2nd Edition Lillian Pierson
- Python: - The Bible- 3 Manuscripts in 1 book: Python Programming for Beginners - Python Programming for Intermediates - Python Programming for Advanced Maurice J. Thompson
- Data Visualization Guide: Clear Guide to Data Science and Visualization Alex Campbell
- Data Science John D. Kelleher
- Learning from Data Introbooks Team
- Everybody Lies: Big Data, New Data, and What the Internet Can Tell Us About Who We Really Are Seth Stephens-Davidowitz
- Python For Data Science: The Ultimate Comprehensive Step-By-Step Guide To The Basics Of Python For Data Science Kevin Clark
- Ultimate Django for Web App Development Using Python Leonardo Lazzaro
- Iron Flame – Flammengeküsst (Flammengeküsst-Reihe 2): Die heißersehnte Fortsetzung des Fantasy-Erfolgs »Fourth Wing« Rebecca Yarros
4.7
- Fourth Wing – Flammengeküsst (Flammengeküsst-Reihe 1) Rebecca Yarros
4.8
- Onyx Storm – Flammengeküsst (Flammengeküsst-Reihe 3): Die heißersehnte Fortsetzung von »Fourth Wing« und »Iron Flame« Rebecca Yarros
4.3
- Fake Dates and Fireworks: Fake Dating und Enemies-to-Lovers: In dieser sexy RomCom sprühen die Funken Kyra Groh
4.4
- Zwei Hexen und ein Whiskey - Guild Codex: Spellbound, Band 3 (Ungekürzte Lesung) Annette Marie
4.6
- Daydream - Maple Hills-Reihe, Teil 3 (Ungekürzt) Hannah Grace
4.4
- Asrai - Das Herz der Drachen Liane Mars
4.5
- Drei Magier und eine Margarita - Guild Codex: Spellbound, Band 1 (Ungekürzte Lesung) Annette Marie
4.6
- Dunkle Künste und ein Daiquiri - Guild Codex: Spellbound, Band 2 (Ungekürzte Lesung) Annette Marie
4.6
- Der verschwundene Buchladen: Der charmanteste und erbaulichste Roman 2024 Evie Woods
4.2
- Powerless - Chestnut Springs, Teil 3 (Ungekürzt) Elsie Silver
4.2
- Fourth Wing (1 of 2) [Dramatized Adaptation]: The Empyrean 1 Rebecca Yarros
4.7
- Dark Cinderella - Northern-Royals-Dilogie, Band 1 (Ungekürzte Lesung) Anya Omah
4.5
- Die Frau des Serienkillers - Die Familie des Serienkillers, Teil 1 (Ungekürzt) Alice Hunter
4.1
- Das Dinner - Alle am Tisch sind gute Freunde. Oder? (Ungekürzte Lesung) Emily Rudolf
3.7
Wähle dein Abo-Modell
Über 600.000 Titel
Lade Titel herunter mit dem Offline Modus
Exklusive Titel und Storytel Originals
Sicher für Kinder (Kindermodus)
Einfach jederzeit kündbar
Unlimited
Nichts ist besser als ein Hörbuch in dieser Saison.
1 Konto
Unbegrenzter Zugriff
Jederzeit kündbar
Wechsel zu Basic jederzeit möglich
Basic
Für alle, die gelegentlich hören und lesen.
1 Konto
20 Stunden/pro Monat
Jederzeit kündbar
Abo-Upgrade jederzeit möglich
Deutsch
Deutschland