
Infrastructure Attack Strategies for Ethical Hacking Himanshu Sharma

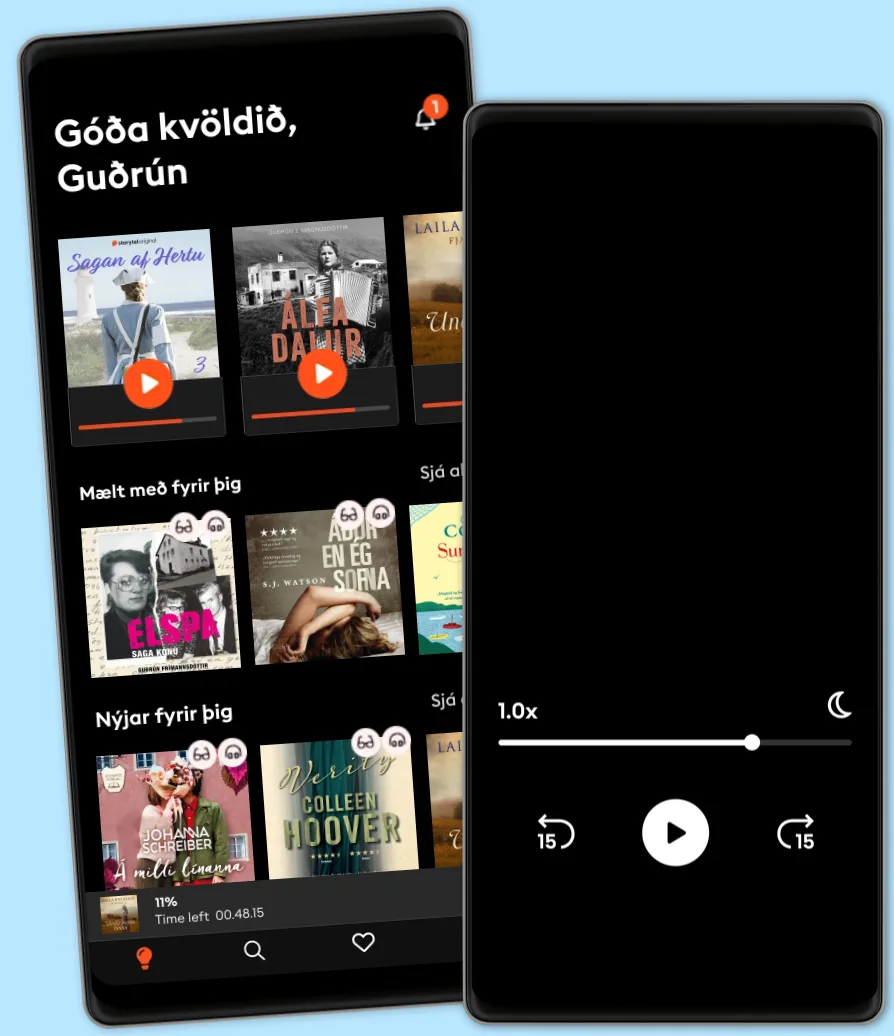
Stígðu inn í heim af óteljandi sögum
Óskáldað efni
Learn how to create interactive and visually aesthetic plots using the Bokeh package in Python
Key FeaturesA step by step approach to creating interactive plots with BokehGo from installation all the way to deploying your very own Bokeh applicationWork with a real time datasets to practice and create your very own plots and applicationsBook Description
Adding a layer of interactivity to your plots and converting these plots into applications hold immense value in the field of data science. The standard approach to adding interactivity would be to use paid software such as Tableau, but the Bokeh package in Python offers users a way to create both interactive and visually aesthetic plots for free. This book gets you up to speed with Bokeh - a popular Python library for interactive data visualization.
The book starts out by helping you understand how Bokeh works internally and how you can set up and install the package in your local machine. You then use a real world data set which uses stock data from Kaggle to create interactive and visually stunning plots. You will also learn how to leverage Bokeh using some advanced concepts such as plotting with spatial and geo data. Finally you will use all the concepts that you have learned in the previous chapters to create your very own Bokeh application from scratch.
By the end of the book you will be able to create your very own Bokeh application. You will have gone through a step by step process that starts with understanding what Bokeh actually is and ends with building your very own Bokeh application filled with interactive and visually aesthetic plots.
What you will learnInstalling Bokeh and understanding its key conceptsCreating plots using glyphs, the fundamental building blocks of BokehCreating plots using different data structures like NumPy and PandasUsing layouts and widgets to visually enhance your plots and add a layer of interactivityBuilding and hosting applications on the Bokeh serverCreating advanced plots using spatial dataWho this book is for
This book is well suited for data scientists and data analysts who want to perform interactive data visualization on their web browsers using Bokeh. Some exposure to Python programming will be helpful, but prior experience with Bokeh is not required.
As a formally educated data scientist with a master’s degree in data science from the prestigious King’s College London, Kevin works as a data scientist with a digital healthcare startup - Connido Limited in London where he is primarily involved with building the descriptive, diagnostic and predictive analytic pipelines. He is also the founder of LinearData- a leading online resource in the field of data science which has over 30,000 unique website hits.
© 2018 Packt Publishing (Rafbók): 9781789131314
Útgáfudagur
Rafbók: 15 juni 2018

 4.64.144.44.44.34.444.44.34.14.23.14.14.4
Yfir 900.000 hljóð- og rafbækur
Yfir 400 titlar frá Storytel Original
Barnvænt viðmót með Kids Mode
Vistaðu bækurnar fyrir ferðalögin
Besti valkosturinn fyrir einn notanda
3290 kr /mánuði
Yfir 900.000 hljóð- og rafbækur
Engin skuldbinding
Getur sagt upp hvenær sem er
Fyrir þau sem vilja deila sögum með fjölskyldu og vinum.
Byrjar á 3990 kr /mánuður
Yfir 900.000 hljóð- og rafbækur
Engin skuldbinding
Getur sagt upp hvenær sem er
3990 kr /mánuði
Íslenska
Ísland