
Modern Web Applications with Next.JS Shubham Jain

Literatura Faktu
This book will help you build interactive graphs that are viewable in any web browser using JavaScript, D3.js, and SVG. You will learn how to make a scatter plot, a bar graph, a pie chart, a force directed graph, and a map.
Key Features
• Takes you through the most common graphs you'll need
•
• Add interactivity to your visualizations
•
• Easy to follow builds
•
Book Description
D3.js is a JavaScript library that allows you to create graphs and data visualizations in the browser with HTML, SVG, and CSS. This book will take you from the basics of D3.js, so that you can create your own interactive visualizations, to creating the most common graphs that you will encounter as a developer, scientist, statistician, or data scientist.
The book begins with an overview of SVG, the basis for creating two-dimensional graphics in the browser. Once the reader has a firm understanding of SVG, we will tackle the basics of how to use D3.js to connect data to our SVG elements. We will start with a scatter plot that maps run data to circles on a graph, and expand our scatter plot to make it interactive. You will see how you can easily allow the users of your graph to create, edit, and delete run data by simply dragging and clicking the graph. Next, we will explore creating a bar graph, using external data from a mock API.
After that, we will explore animations and motion with a bar graph, and use various physics-based forces to create a force-directed graph. Finally, we will look at how to use GeoJSON data to create a map.
What you will learn
• Build a scatter plot
•
• Build a bar graph
•
• Build a pie chart
•
• Build a force-directed graph
•
• Build a map
•
• Build interactivity into your graphs
•
Who this book is for
This book is for web developers, interactive news developers, data scientists, and anyone interested in representing data through interactive visualizations on the Web with D3. Some basic knowledge of JavaScript is expected, but no prior experience with data visualization or D3 is required to follow this book.
© 2018 Packt Publishing (E-book): 9781789347746
Wydanie
E-book: 27 września 2018


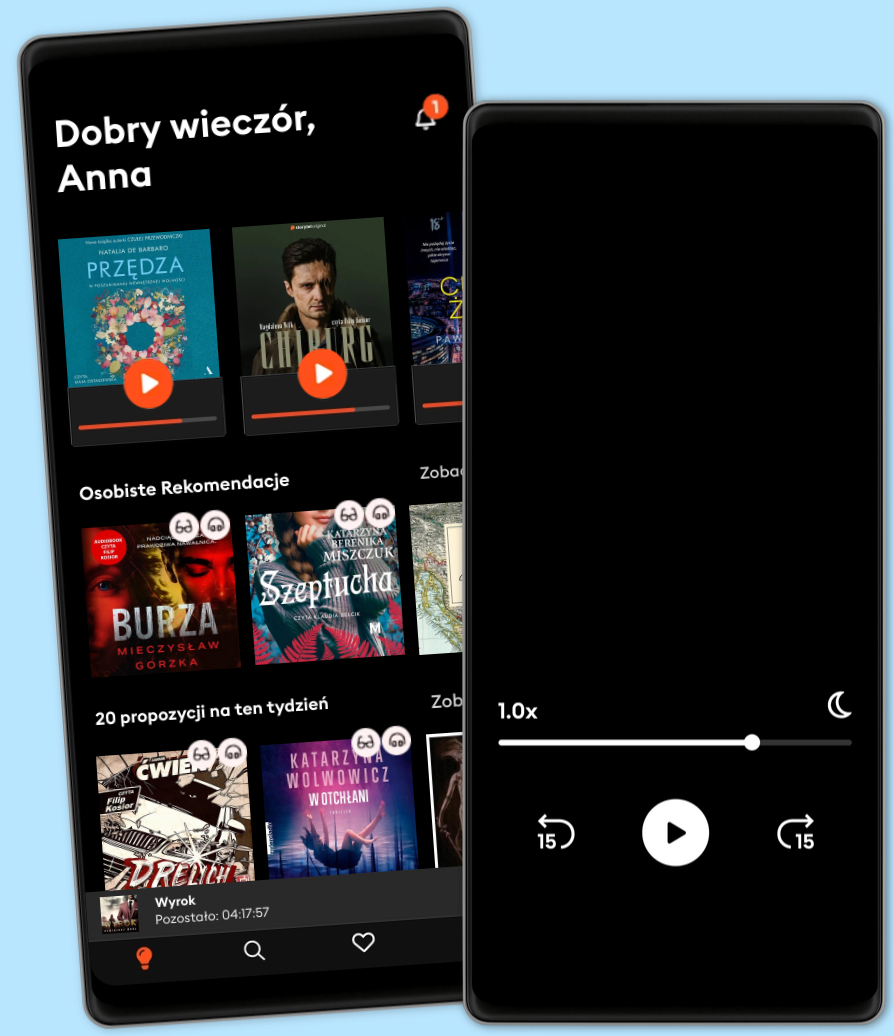
Ponad 500 000 tytułów w cenie jednego abonamentu
Słuchaj i czytaj w trybie offline
Ekskluzywne produkcje audio Storytel Original
Tryb dziecięcy Kids Mode
Anuluj kiedy chcesz
Dla tych, którzy chcą słuchać i czytać bez limitów.
39.90 zł /30 dni
1 konto
Nieograniczony Dostęp
Słuchanie bez limitów
Anuluj w dowolnym momencie
Dla tych, którzy chcą słuchać i czytać bez limitów.
39.90 zł /30 dni
1 konto
Nieograniczony Dostęp
Słuchanie bez limitów
Anuluj w dowolnym momencie
Dla tych, którzy słuchają i czytają od czasu do czasu.
22.90 zł /30 dni
1 konto
10 godzin/miesięcznie
Anuluj w dowolnym momencie
Dla tych, którzy chcą dzielić się historiami ze znajomymi i rodziną.
Od 59.90 zł /30 dni
2-3 konta
Nieograniczony Dostęp
Słuchanie bez limitów
Anuluj w dowolnym momencie
Ty + 1 członek rodziny
2 konta59.90 zł /30 dni