
Wieża jaskółki Andrzej Sapkowski
 4.9
4.9

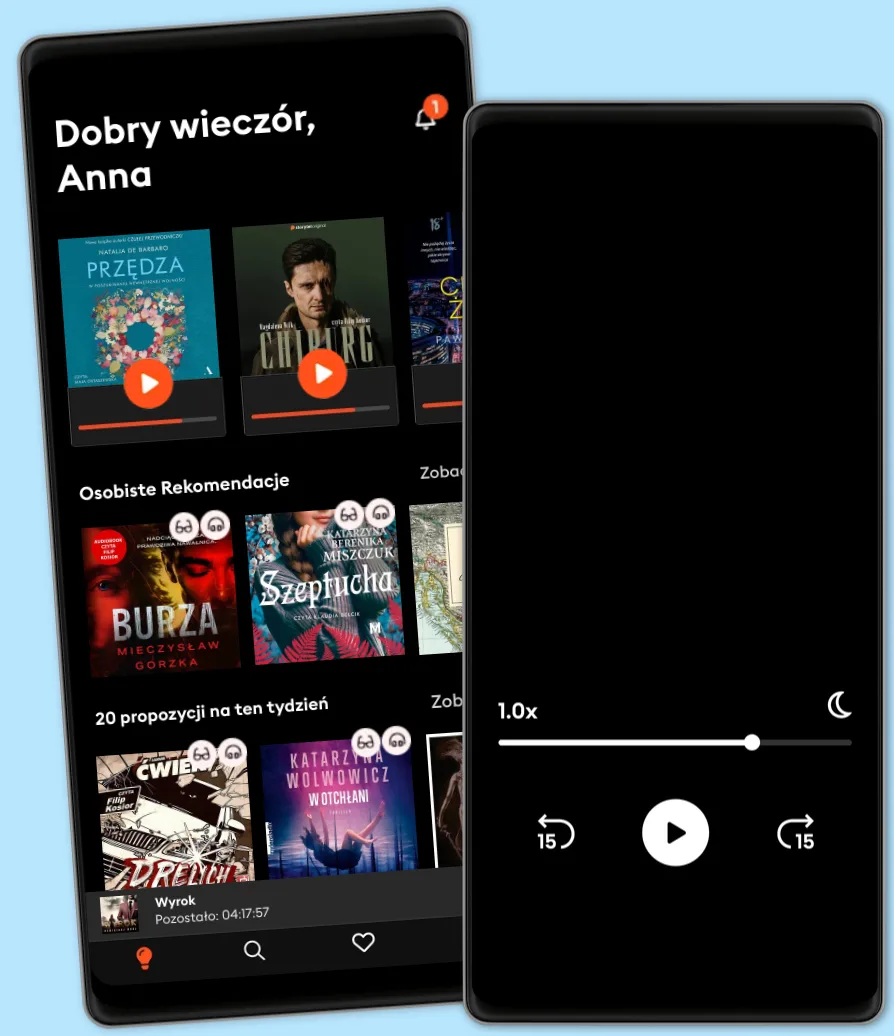
Romans na spacerze? Kryminał w drodze do pracy? Wciągający thriller, gdy gotujesz? Z ponad 500 tys. tytułów do wyboru, nigdy nie zabraknie Ci najlepszych historii. Zacznij słuchać już dziś - ale uważaj, te emocje uzależniają!
Literatura Faktu
Create industry-compliant graphs with this practical guide for professionals
Analysis of clinical trial results is easier when the data is presented in a visual form. However, clinical graphs must conform to specific guidelines in order to satisfy regulatory agency requirements. If you are a programmer working in the health care and life sciences industry and you want to create straightforward, visually appealing graphs using SAS, then this book is designed specifically for you. Written by two experienced practitioners, the book explains why certain graphs are requested, gives the necessary code to create the graphs, and shows you how to create graphs from ADaM data sets modeled on real-world CDISC pilot study data.
SAS Graphics for Clinical Trials by Example demonstrates step-by-step how to create both simple and complex graphs using Graph Template Language (GTL) and statistical graphics procedures, including the SGPLOT and SGPANEL procedures. You will learn how to generate commonly used plots such as Kaplan-Meier plots and multi-cell survival plots as well as special-purpose graphs such as Venn diagrams and interactive graphs. Because your graph is only as good as the aesthetic appearance of the output, you will learn how to create a custom style, change attributes, and set output options. Whether you are just learning how to produce graphs or have been working with graphs for a while, this book is a must-have resource to solve even the most challenging clinical graph problems.
© 2020 SAS Institute (E-book): 9781952365973
Wydanie
E-book: 25 listopada 2020
4.94.74.54.84.64.74.44.84.94.74.84.74.64.34.7Ponad 500 000 tytułów w cenie jednego abonamentu
Wypróbuj przez 7 dni
Słuchaj i czytaj w trybie offline
Ekskluzywne produkcje audio Storytel Original
Tryb dziecięcy Kids Mode
Anuluj kiedy chcesz
Dla tych, którzy chcą słuchać i czytać bez limitów.
39.90 zł /30 dni
1 konto
Słuchanie bez limitów
Anuluj w dowolnym momencie
Dla tych, którzy chcą słuchać i czytać bez limitów.
39.90 zł /30 dni
1 konto
Słuchanie bez limitów
Anuluj w dowolnym momencie
Dla tych, którzy słuchają i czytają od czasu do czasu.
22.90 zł /30 dni
1 konto
10 godzin / miesiąc
Anuluj w dowolnym momencie
Dla tych, którzy chcą dzielić się historiami ze znajomymi i rodziną.
Od 59.90 zł /30 dni
2–3 konta
Słuchanie bez limitów
Anuluj w dowolnym momencie
59.90 zł /30 dni
Polski
Polska