
Battling With the Truth: The Contrast in the Media Reporting of World War II Ian Garden

Óskáldað efni
Take your QlikView skills to the next level and master the art of creating visual data analysis for real business needs
About This Book
• Explore how to create your own QlikView data laboratory and how to develop QlikView applications using agile project methods
• Implement advanced data visualization and analysis for common business requirements from the sales, finance, marketing, inventory, operations, and human resources departments
• Learn from real-life experience shared in this book that will give you the upper hand in your next QlikView project
Who This Book Is For
This book is intended for developers who want to go beyond their technical knowledge of QlikView and understand how to create analysis and data visualizations that solve real business needs. You should have a basic understanding of advanced QlikView functions.
What You Will Learn • Apply advanced QlikView techniques such as set analysis and nested aggregation in order to deliver common business requirements
• Understand real business requirements for sales, finance, marketing, and human resources departments
• Discover when to apply more advanced data visualization such as frequency polygons, bullet graphs, and XmR charts
• Go beyond native QlikView and include geographical analysis, planning, and sentiment analysis in your QlikView application
• Troubleshoot common errors we discover at the moment we visualize data in QlikView
• Develop a plan to master Qlik Sense data visualization
In Detail
Just because you know how to swing a hammer doesn't mean you know how to build a house. Now that you've learned how to use QlikView, it's time to learn how to develop meaningful QlikView applications that deliver what your business users need.
You will explore the requirements and the data from several business departments in order to deliver the most amazing analysis and data visualizations. In doing so, you will practice using advanced QlikView functions, chart object property options, and extensions to solve real-world challenges.
Style and approach
This hands-on guide follows the story of a company implementing QlikView as its enterprise data discovery solution. Each chapter starts with an understanding of the business requirements and the data model, and then helps you create insightful analysis and data visualizations. Each chapter expands on what was done in the previous chapter as we follow this continuously improving iterative process.
© 2016 Packt Publishing (Rafbók): 9781782173267
Útgáfudagur
Rafbók: 25 april 2016


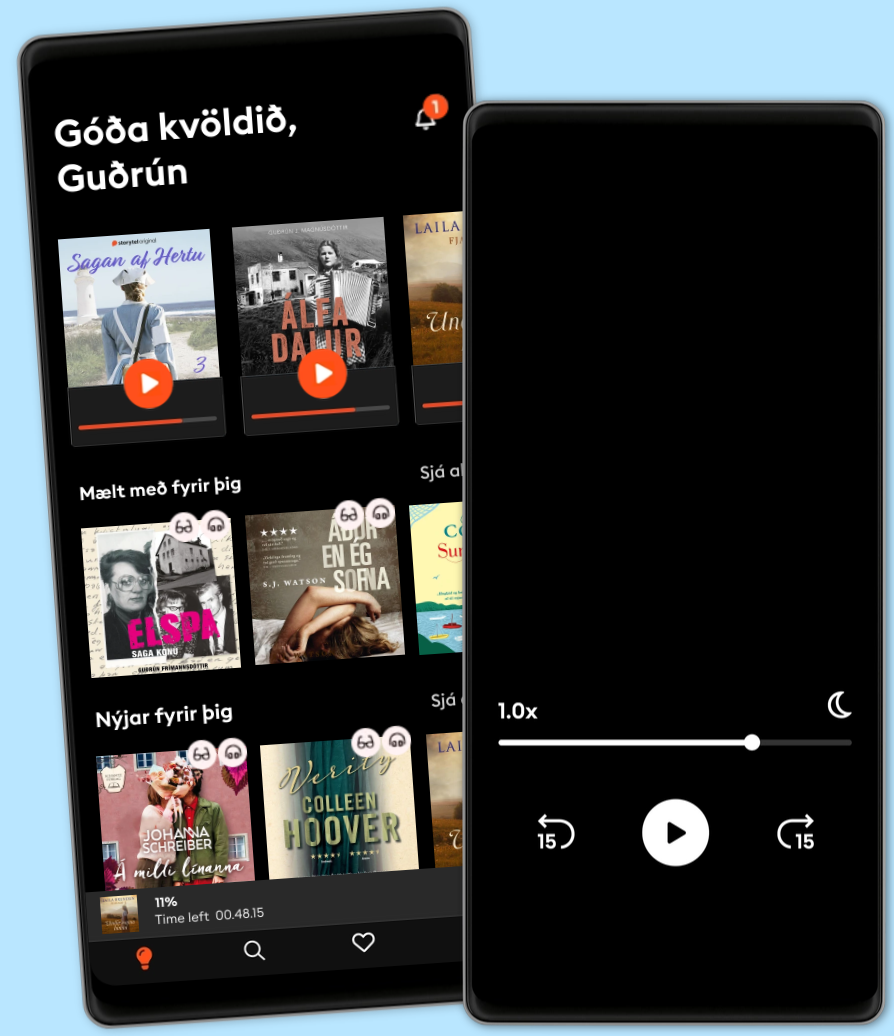
1 milljón hljóð- og rafbækur
Barnvænt viðmót með Kids Mode
Hlustaðu og lestu á sama tíma
Vistaðu bækurnar fyrir ferðalögin
Besti valkosturinn fyrir einn notanda
3290 kr á mánuði
1 aðgangur
Ótakmörkuð hlustun
1 milljón hljóð- og rafbækur
Engin skuldbinding
Getur sagt upp hvenær sem er
Fyrir þau sem vilja deila sögum með fjölskyldu og vinum.
Frá 3990 kr á mánuði
2-6 aðgangar
100 klst/mán fyrir hvern aðgang
1 milljón hljóð- og rafbækur
Engin skuldbinding
Getur sagt upp hvenær sem er
Þú + 1 fjölskyldumeðlimur
2 aðgangar3990 kr á mánuði